Thursday, November 11, 2004
Electoral Map Crazy


e). This is however the cartogram for the above map and things look very different.

e). This map now tries to represent the actual votes counted county by county. (see how ones perception changes from the first county map, however do note a straight line of red through middle America. )

g). Finally this is the cartogram for the above picture which gives the best picture of all.

(with maps from MSNBC, USA Today, Purdue and University of Michigan.)
¶ permalink

Update : Video graphically illustrating county results.
The US Elections have come and gone. There have been countless theories on why it turned out the way it did , from moral values being the deciding factor, to the Republicans registering more of their core base, to the Democrats not having a clear message and so on.
Along with that there have been a plethora of maps too, to show what really happened. I have put together a sort of library of maps to show what "really" happened as opposed to what you might actually see in "popular media"
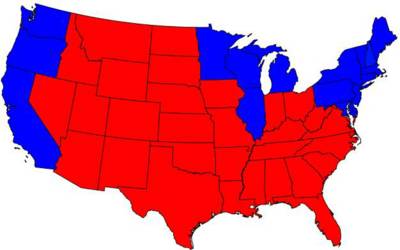
1). This is the most popular simple map.
Just shows the different states colored with their majority party color. Looks pretty red doesn't it. A bit misleading though.
Just shows the different states colored with their majority party color. Looks pretty red doesn't it. A bit misleading though.
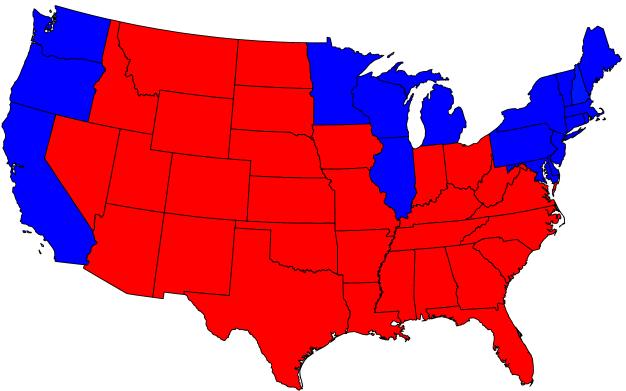
2). This represents the true picture as far as the electoral college votes by state go.
This is a cartogram which shows each state appropriately ballooned or shrunk based on the electoral votes that the state actually represent.(look at the super inflated California :) ). So in other terms while the one above was an area representation this is a more accurate population/electoral vote representation.
This is a cartogram which shows each state appropriately ballooned or shrunk based on the electoral votes that the state actually represent.(look at the super inflated California :) ). So in other terms while the one above was an area representation this is a more accurate population/electoral vote representation.

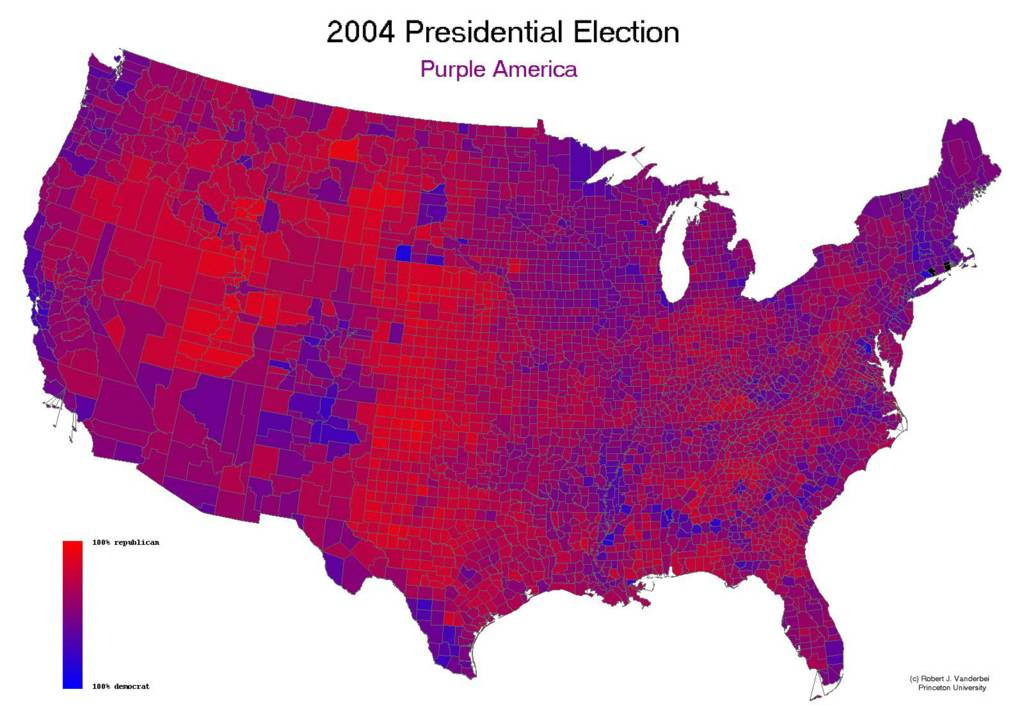
3). Now, still looking at states if we know look at the actual number of votes cast in each state and accordingly color the states (with blue being fully democrat and red fully republican) we see a pretty "purple" nation, not wholly red or blue.

d). Now, drilling down a bit and we have this map which shows the results county by county.
This is again like the first picture, just a binary picture though shows just which party had more votes in a particular county and paints the county with that color. Its red all over with few sprinkling of blue here and there. Again this doesn't take into account the actual number of votes polled.

e). This is however the cartogram for the above map and things look very different.

e). This map now tries to represent the actual votes counted county by county. (see how ones perception changes from the first county map, however do note a straight line of red through middle America. )
g). Finally this is the cartogram for the above picture which gives the best picture of all.

(with maps from MSNBC, USA Today, Purdue and University of Michigan.)
¶ permalink
Comments:
<< Home

[Paddy] :). Thank you for the link. Very interesting. Projections themselves are a fascinating topic. Atleast one of the attributes of the spheroid that the earth is, is distorted when we take any projection. The mercator projection by far the most popular is skewed as far as the size is concerned.I much prefer the Peters Map http://en.wikipedia.org/wiki/Image:PetersMap.jpg
which preserves the area :)
which preserves the area :)
Anirudh,
Going by the Mercator projection India looks cheated because of the proximity to equator whereas Greenland gets more than its share but never knew about the maps you were talking about..
Post a Comment
Going by the Mercator projection India looks cheated because of the proximity to equator whereas Greenland gets more than its share but never knew about the maps you were talking about..
<< Home
